In this article we will introduce with the ColumnChart control in ASP.NET using C#.
ColumnChart Example in ASP.NET using C#
ColumnChart in ASP.NET is used for data visualization. Series of ColumnChart
just likes a rectangle. It has two dimensions x-axis and y-axis. Category labels
are displayed in x-axis. Values are represented by the height of the columns as
measured by the y-axis. In this example we make a table in sqldatabase and make
SQLDatasource for provide the data to the ColumnChart. You can set the style,
title, x-axis category name and y-axis value name by using
ChartAreas, Legends. Series and Titles collections.
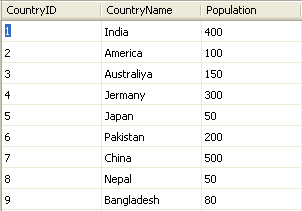
The table of data is following.

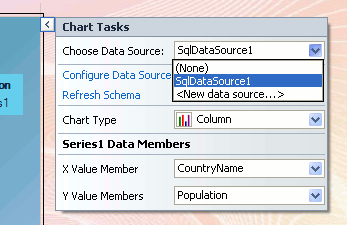
You click the special tag button of ColumnChart for make a connection with
databases and table. Click Choose Data Source dropdownlist and
select New data source and make data connection with Chart
The following figure shows how can I use SQLDataSource.

You can set the Column Type from in this. When You Configure the connection with database now You will set the X value member and Y value member. You can see the above figure.
ColumnChart.aspx (Design Page):

ColumnChart.aspx (source code):
<%@ Page Title="" Language="C#" MasterPageFile="~/RoseindiaMaster.master" AutoEventWireup="true" CodeFile="ColumnChart.aspx.cs" Inherits="ColumnChart" %> <%@ Register assembly="System.Web.DataVisualization, Version=4.0.0.0, Culture=neutral, PublicKeyToken=31bf3856ad364e35" namespace="System.Web.UI.DataVisualization.Charting" tagprefix="asp" %> <asp:Content ID="Content1" ContentPlaceHolderID="head" Runat="Server"> </asp:Content> <asp:Content ID="Content2" ContentPlaceHolderID="ContentPlaceHolder1" Runat="Server"> <div> <h2 style="color:Green">Column Chart in ASP.NET 4, C#</h2> <asp:Chart ID="Chart1" runat="server" DataSourceID="SqlDataSource1" Height="507px" Width="544px" Palette="Light" BackColor="Teal" BackGradientStyle="DiagonalLeft" BackImageWrapMode="Scaled"> <series> <asp:Series Name="Series1" XValueMember="CountryName" YValueMembers="Population" Legend="Legend1" YValuesPerPoint="2"> </asp:Series> </series> <chartareas> <asp:ChartArea Name="ChartArea1" BackColor="RosyBrown" BackGradientStyle="Center" BorderColor="DarkRed"> <AxisY Title="---Population----" TitleFont="Microsoft Sans Serif, 10pt, style=Bold"> </AxisY> <AxisX Title="---Country---" TitleFont="Microsoft Sans Serif, 10pt, style=Bold"> </AxisX> <Area3DStyle Enable3D="True" /> </asp:ChartArea> </chartareas> <Legends> <asp:Legend Name="Legend1" Title="Population" BackColor="128, 255, 255"> </asp:Legend> </Legends> <Titles> <asp:Title Name="Survay 2010" Font="Microsoft Sans Serif, 16pt, style=Bold" Text="<---Survay 2010--->"> </asp:Title> </Titles> </asp:Chart> <asp:SqlDataSource ID="SqlDataSource1" runat="server" ConnectionString="<%$ ConnectionStrings:ChartDatabaseConnectionString %>" SelectCommand="SELECT * FROM [ChartPopulation]"></asp:SqlDataSource> <br /> </div> </asp:Content>
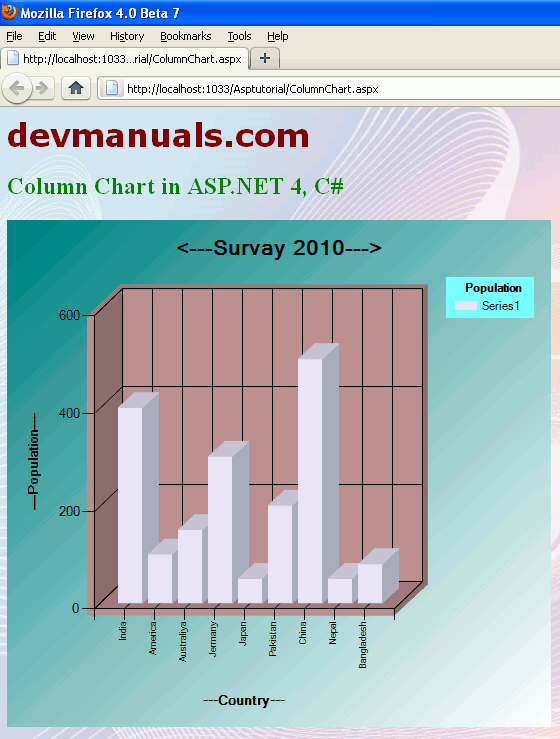
Output:


[ 0 ] Comments